Ham Radio School Visualization Apps
A big part of the Ham Radio School method of helping students prepare for license exams with real comprehension of radio topics is visualization. Particularly when it comes to some of the more technical processes involved in radio science and engineering, we have found that student understanding of these topics extends directly from our extensive use of graphics, video, animations, and other tools that help them visualize these processes. As such, we provide ample visual models in our books, in our online course video lessons, and in our optional depth learning media at HamRadioSchool.com.
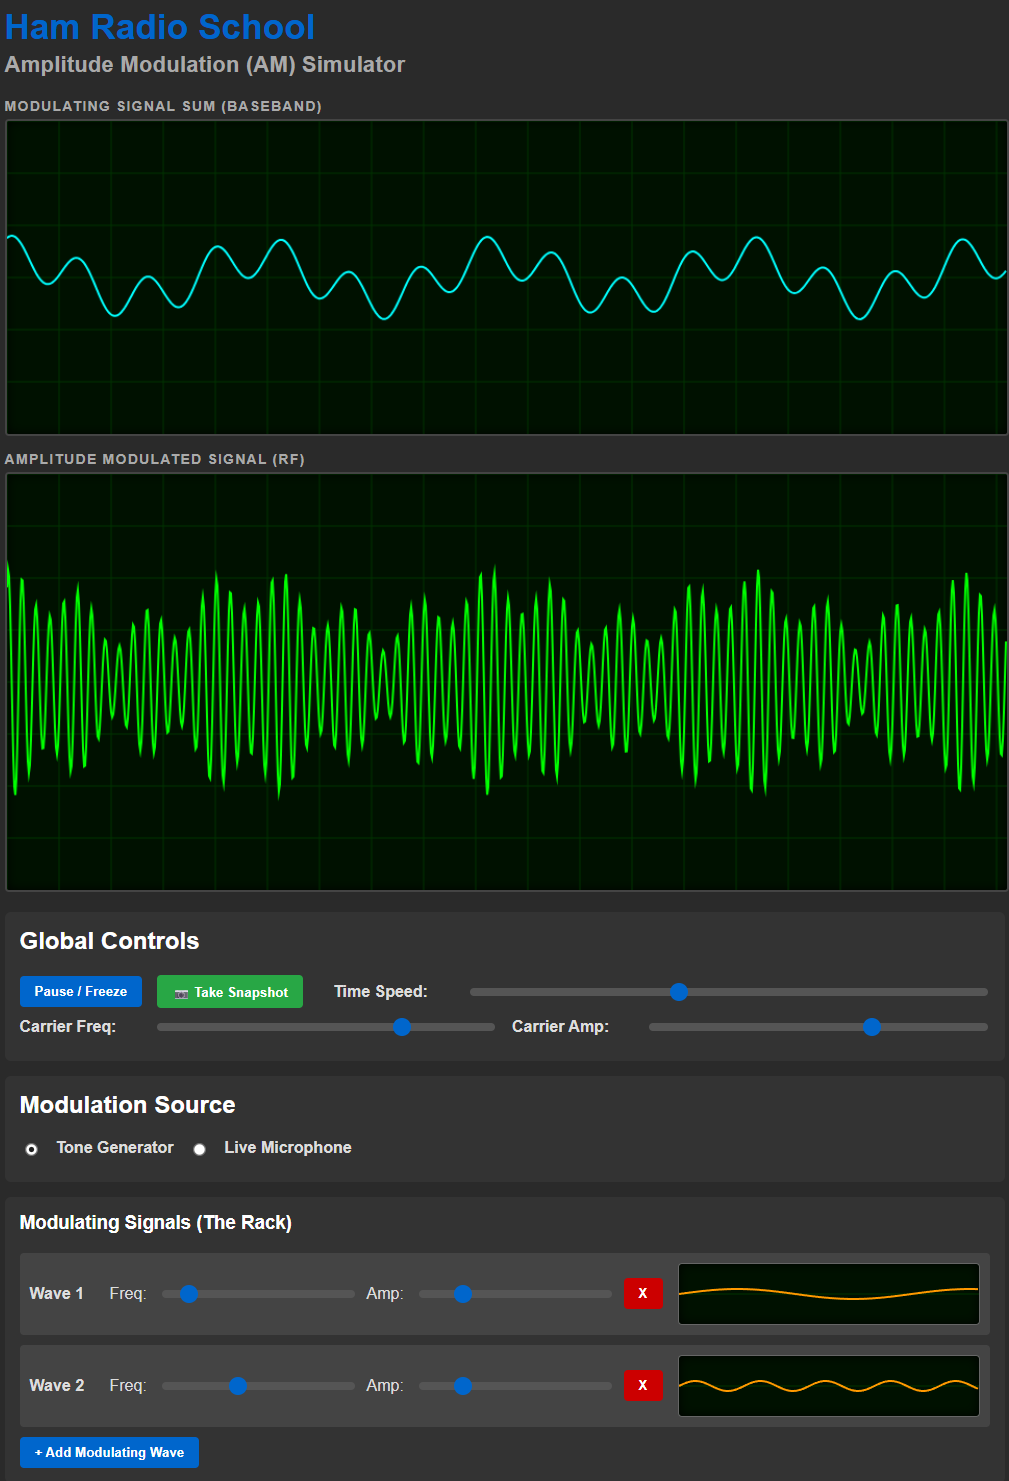
- AM Simulator - construct a baseband signal, watch it modulate an RF carrier.
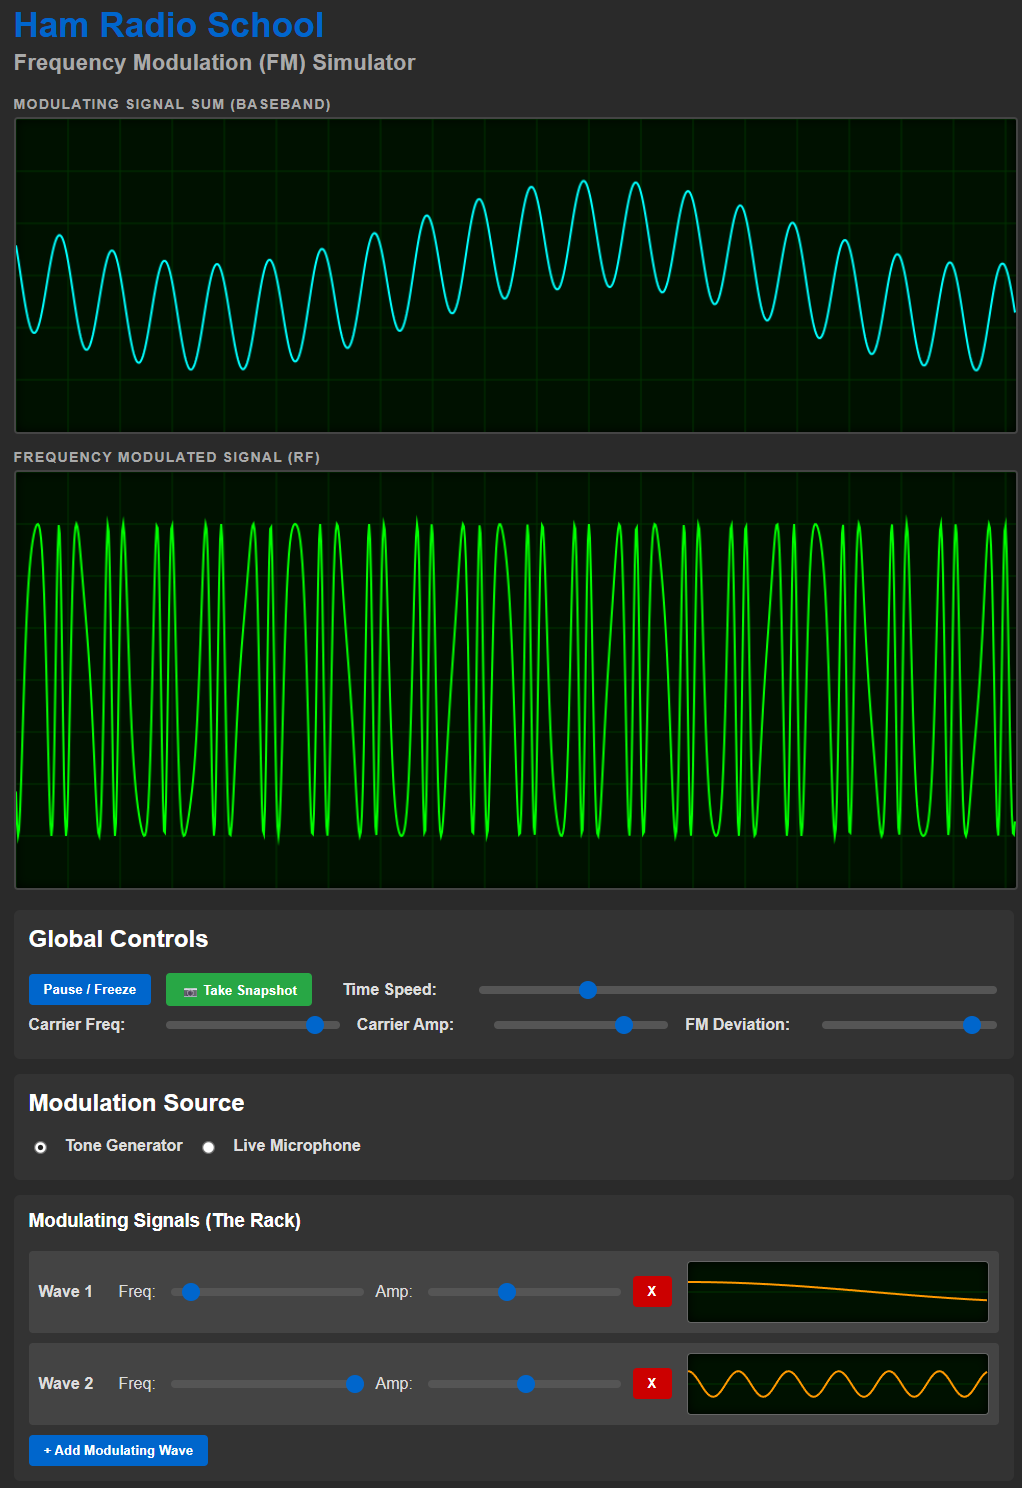
- FM Simulator - construct a baseband signa, watch it frequency modulate a carrier.
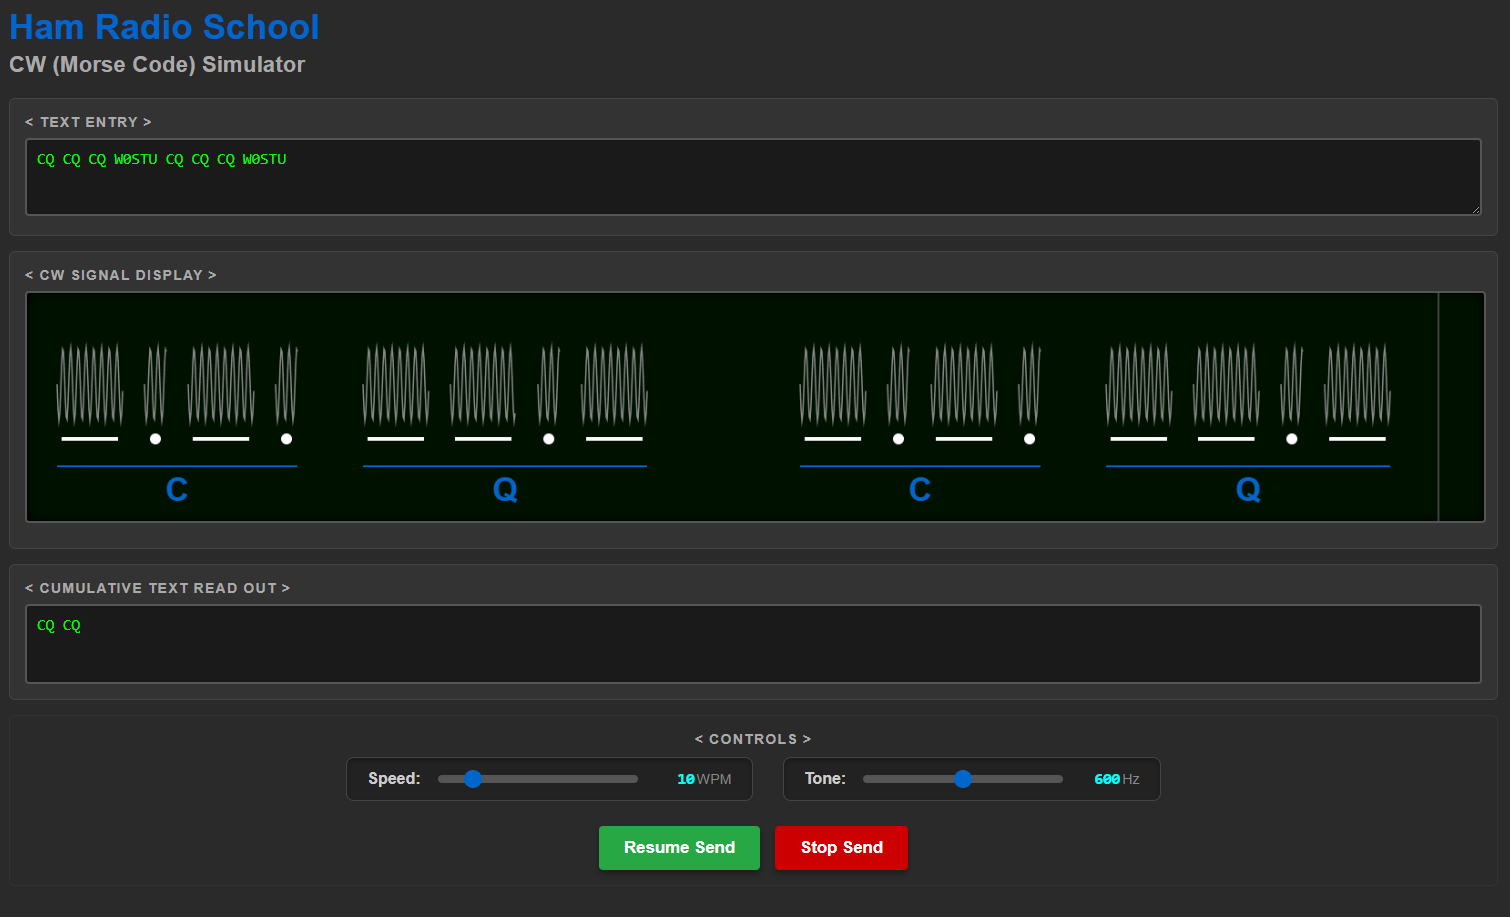
- CW Simulator - enter text and see/hear it coded; adjust WPM speed & audio tone.
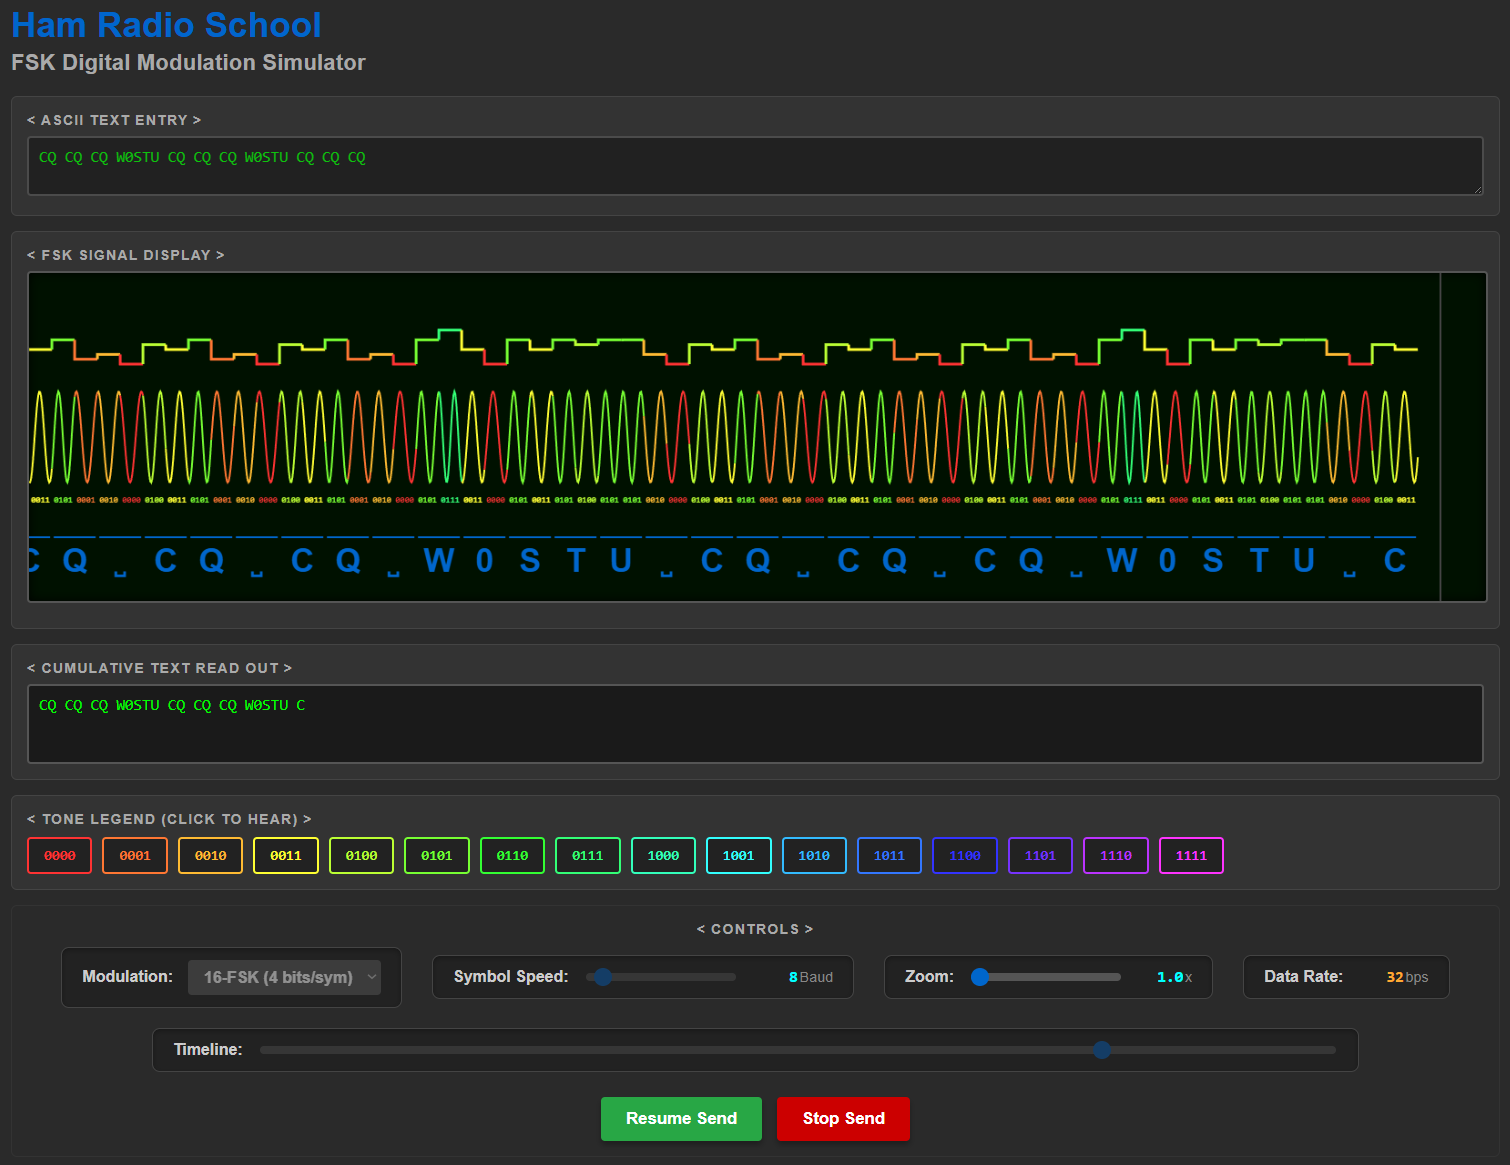
- FSK Simulator - enter text and see/hear it coded as 2-, 4-, or 16-FSK signals.
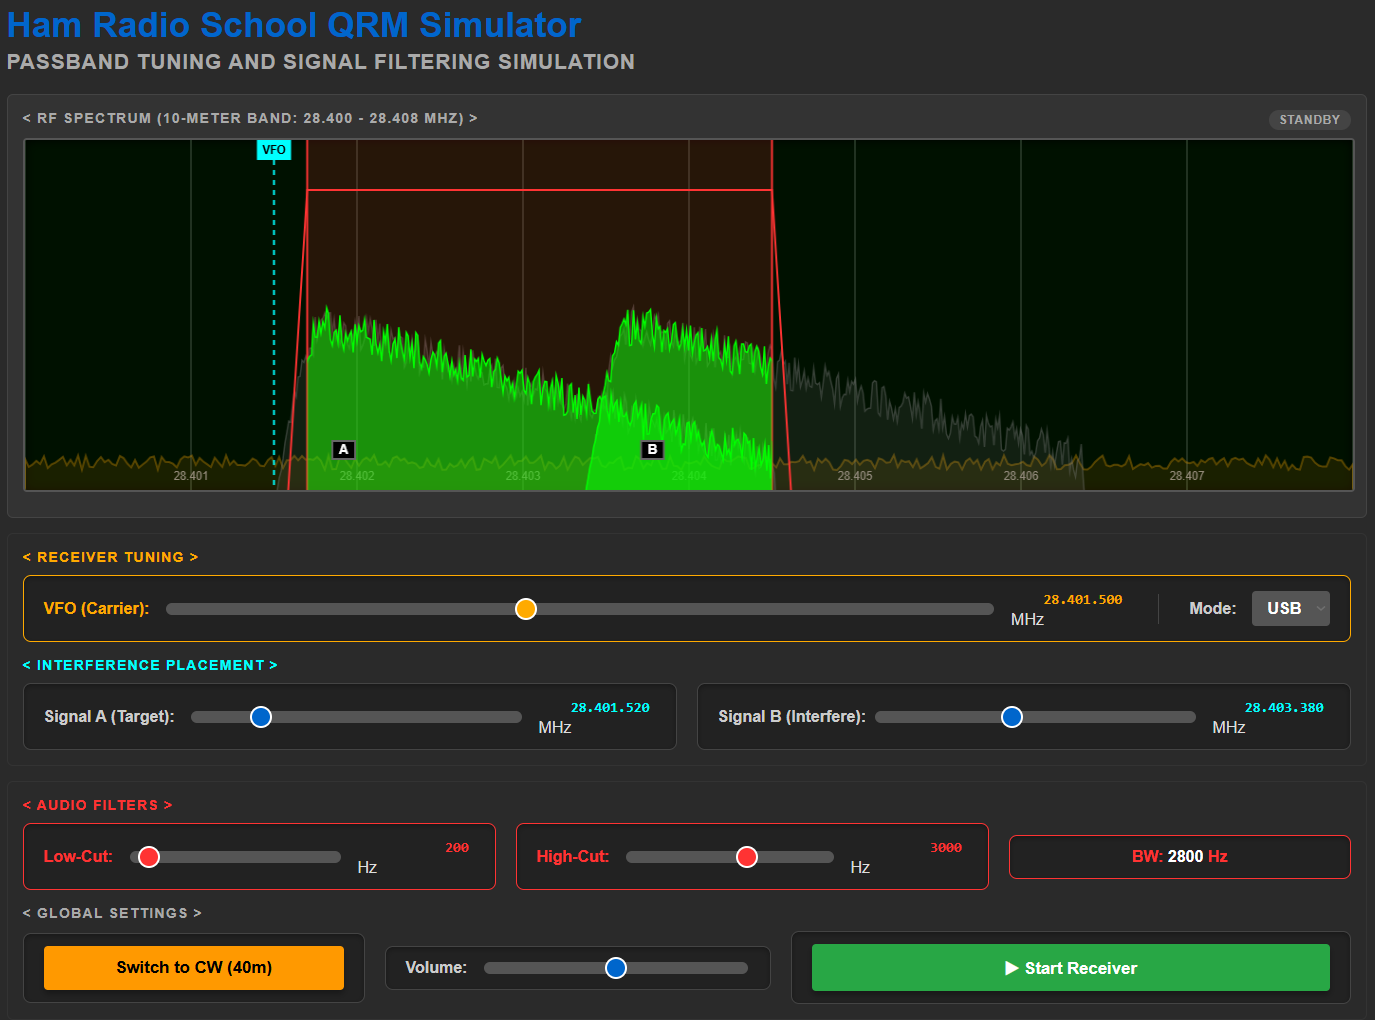
- QRM Simulator - see a spectrum scope and hear audio effects of inerfering SSB and CW signals; adjust signal positions and receive filter settings to hear results.
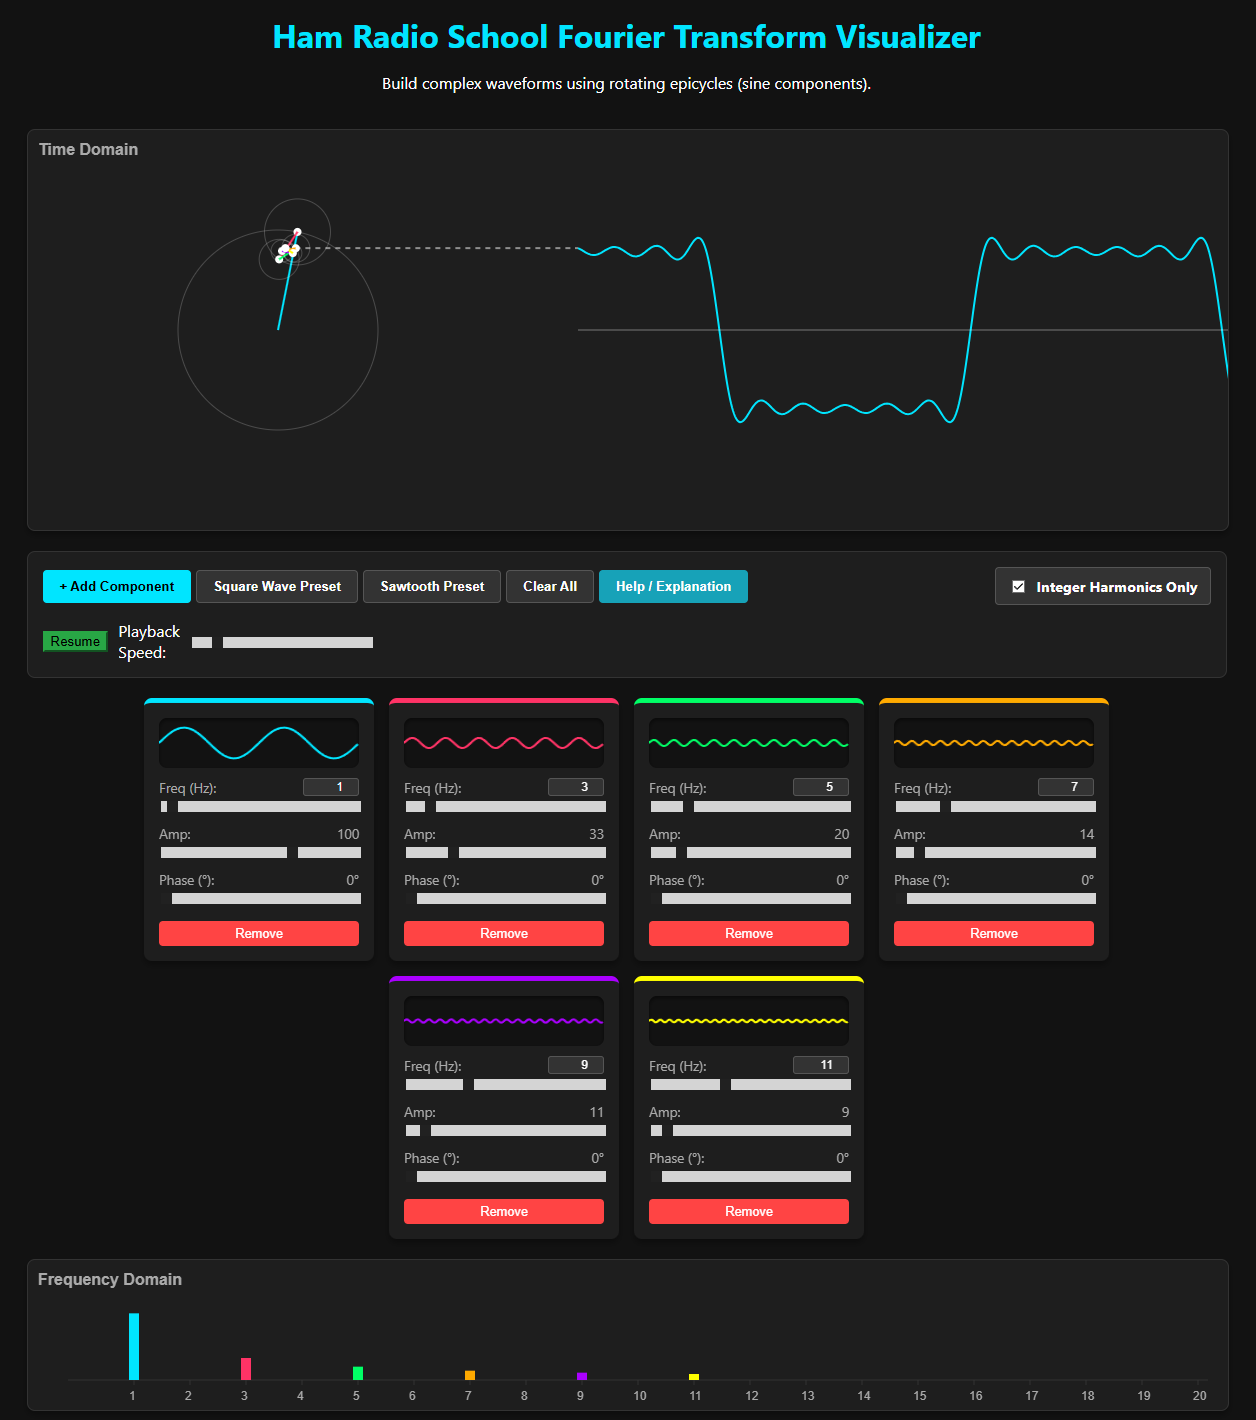
- Fourier Transform Visualizer - construct complex waveforms by adding sine wave components and adjusting frequencies, amplitudes, and phases. View signals in the time domain and frequency domain to intutively understand Fourier Transforms.
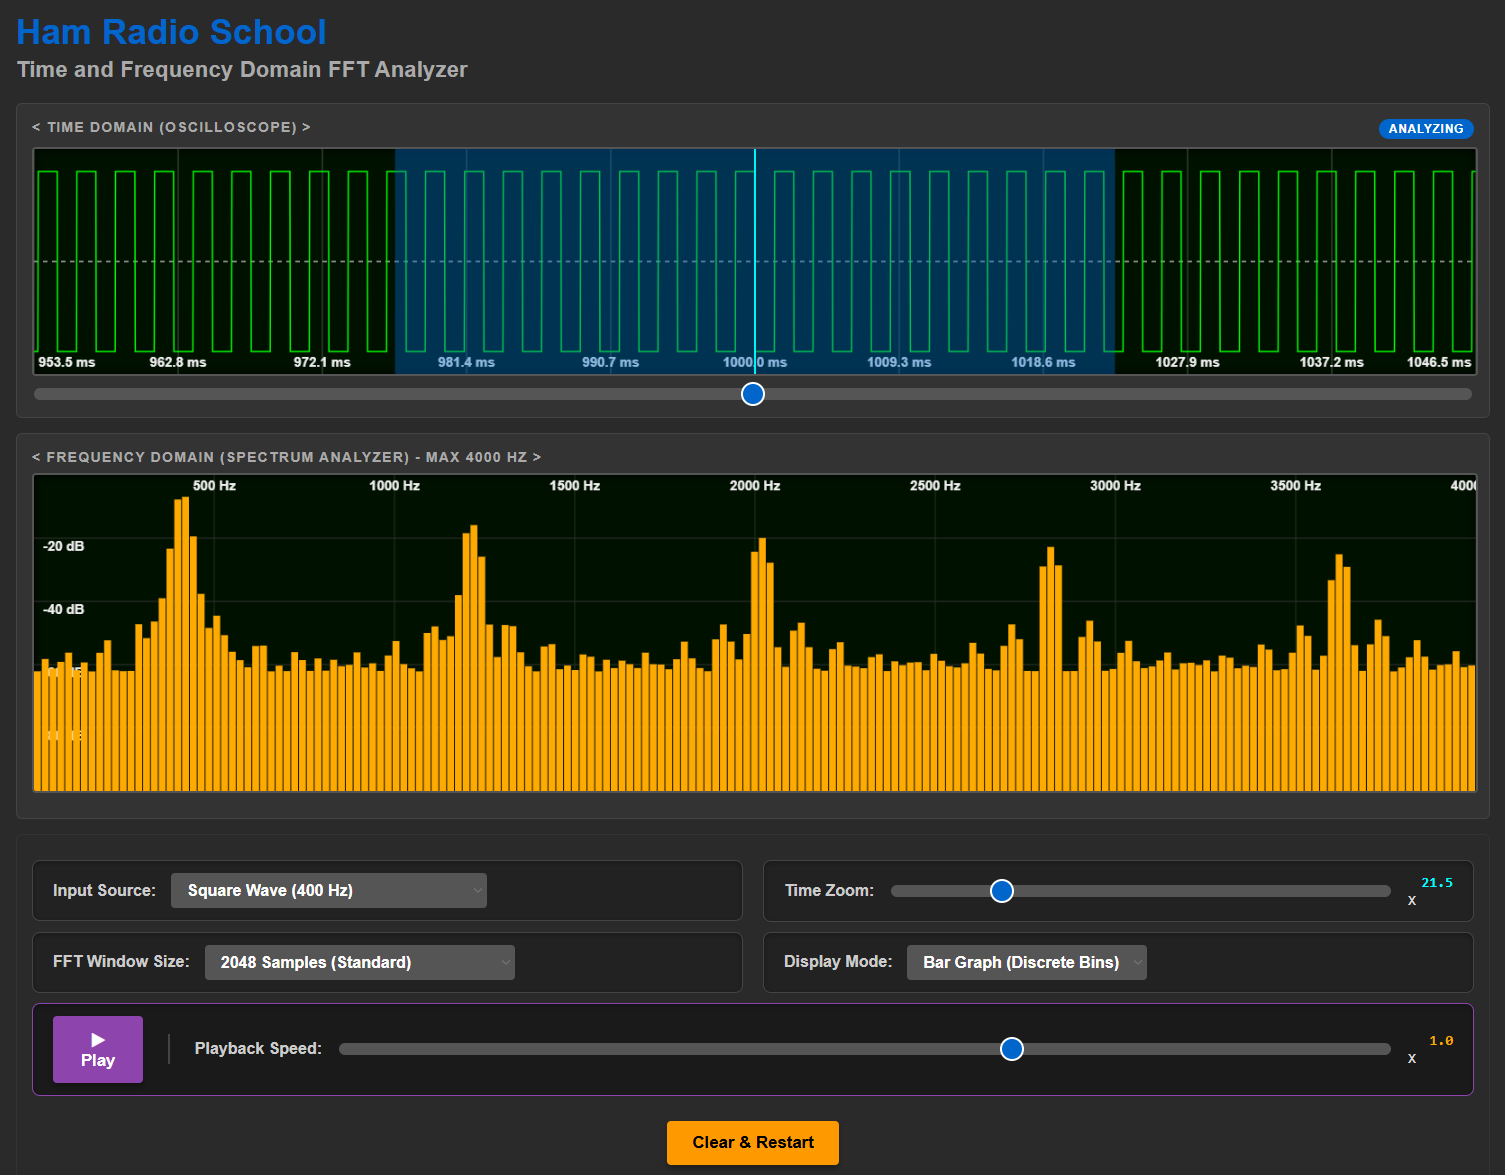
- Time & Frequency Domain FFT Analyzer - record your own audio and see its displayed in time and frequency domains; stock input signals available also.
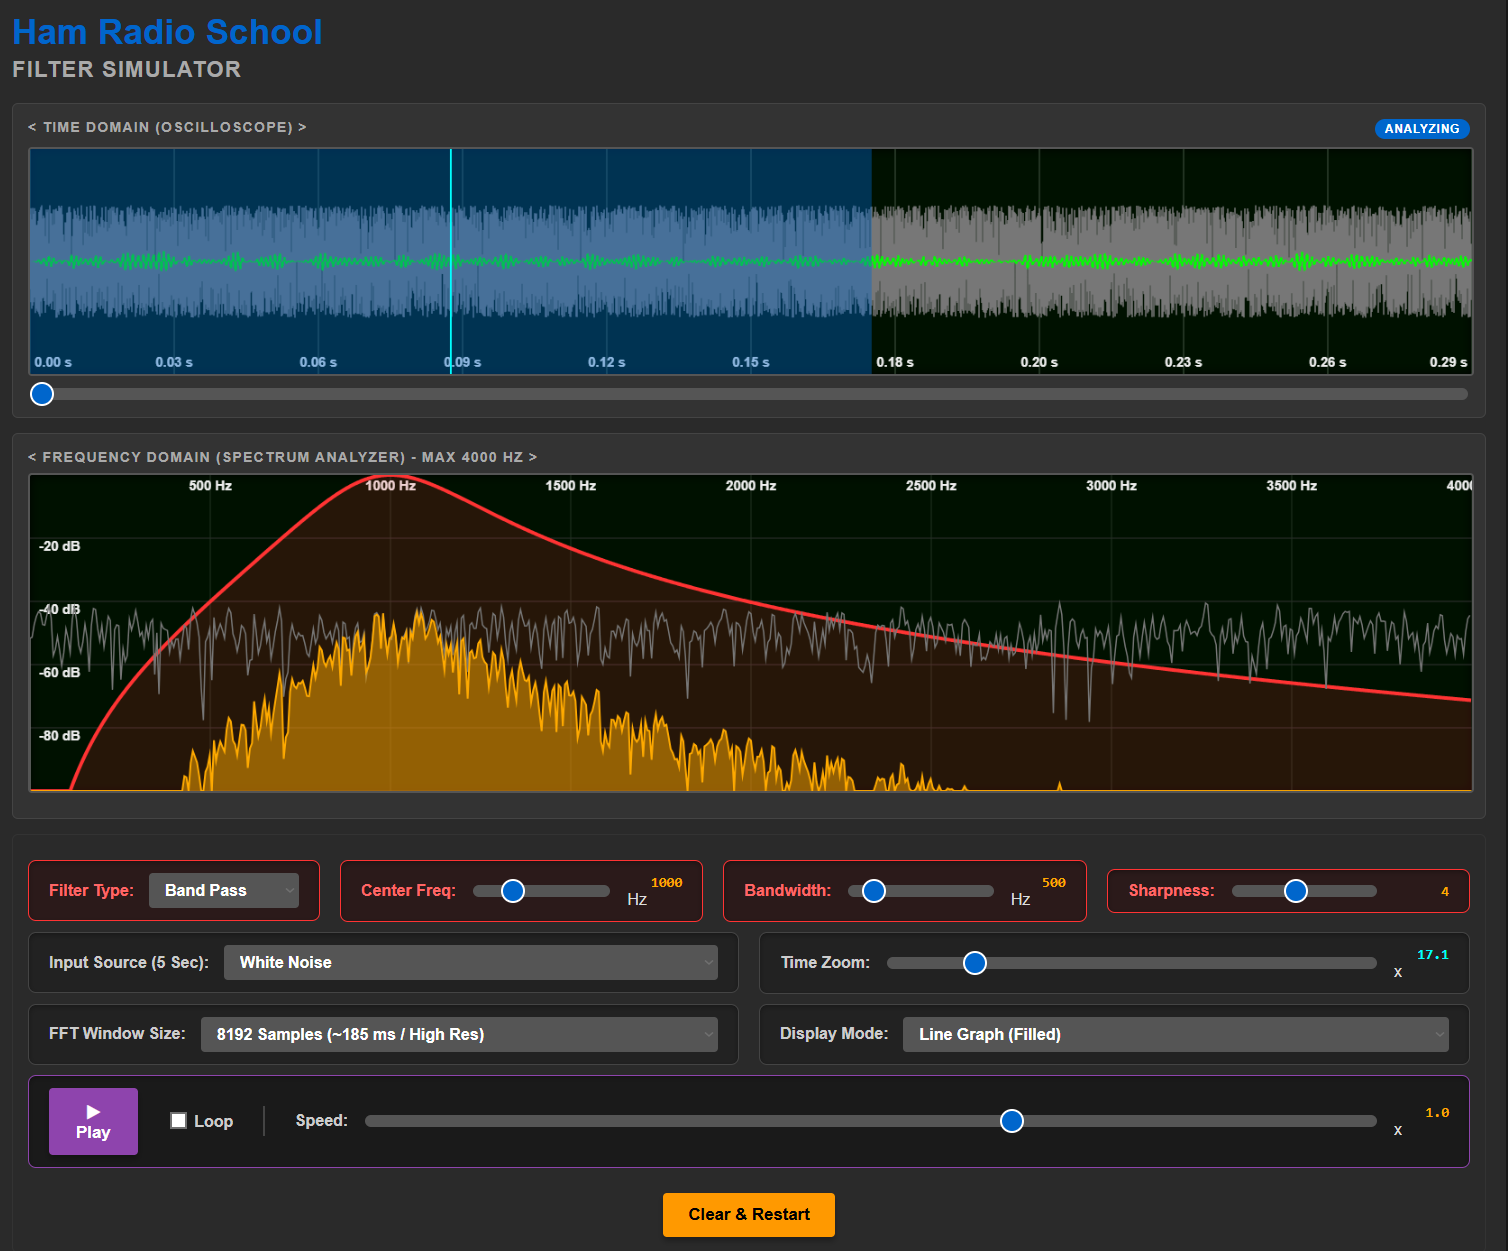
- Filter Simulator - record your own audio or use stock audio signals to explore various filter effects; see and hear high pass, low pass, band pass options.
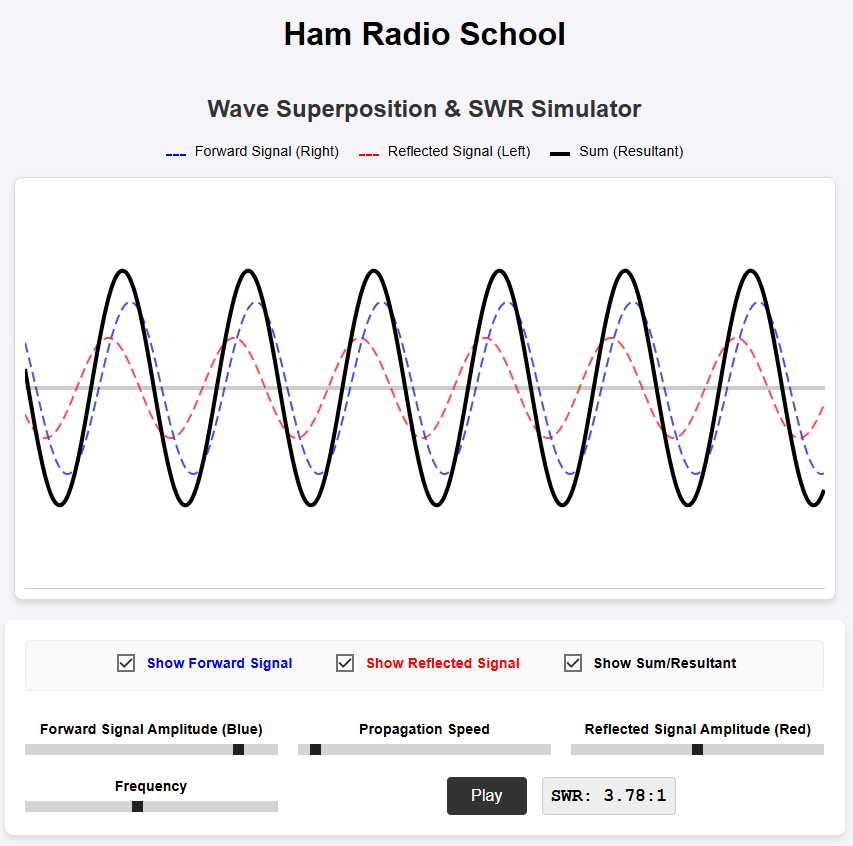
- SWR Wave Simulator - illustrates forward and reflected transmission line signals, the resultant standing waves, and computes SWR.
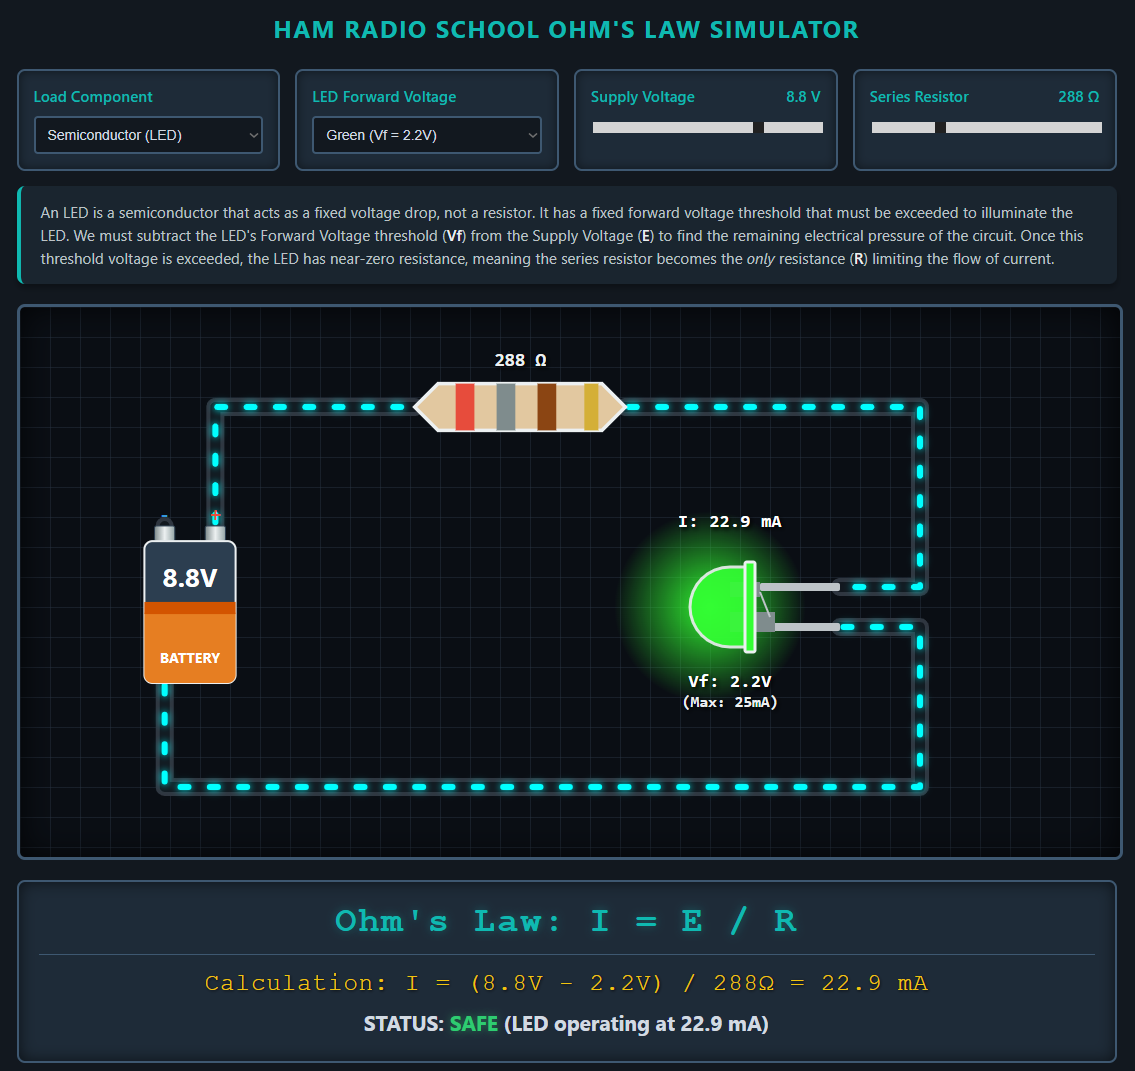
- Ohm's Law Simulator - illustrates a simple DC circuit with lamp or LED and resistor; adjust supply voltage and resistance to see current effects and Ohm's Law calculations.
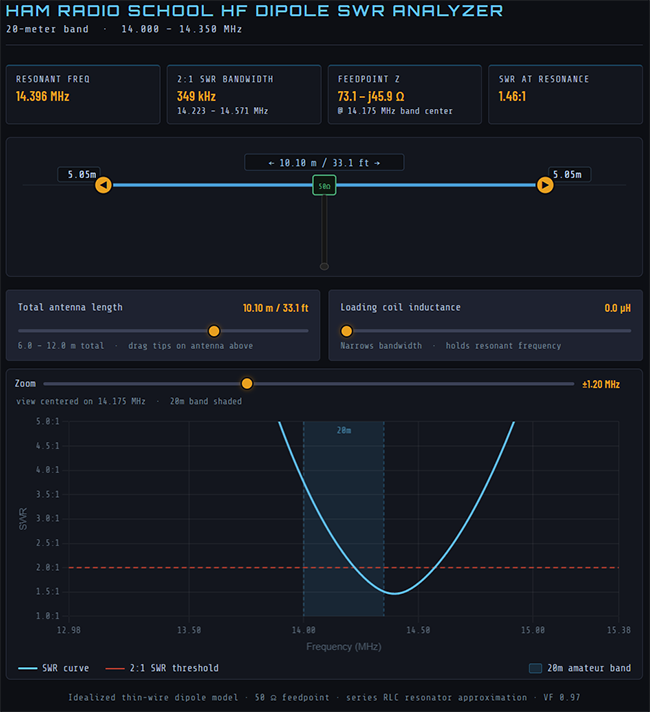
- HF Dipole SWR Analyzer - Illustrates how a 20-meter band wire dipole modifications of length and loading impact the SWR curve of the antenna system; adjust antenna length and loading to see the SWR curve change in response.
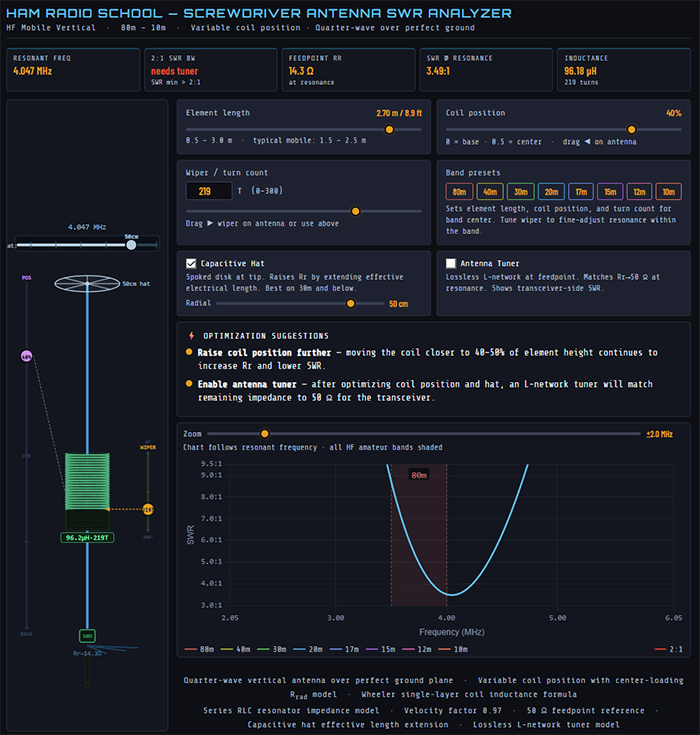
- Screwdriver Antenna SWR Analyzer - Illustrates the design options and tuning capabilities of a variable loaded vertical quarter-wave antenna across the HF bands from 80 to 10 meters; adjust loading coil size and position, antenna length, and capacitance hat features to observe SWR curve impacts.
Find all of our visualization apps here: https://hamradioschool.com/vis-apps.html
Provide input to the app by selecting and constructing a baseband modulating signal. Sum together modulating signal sine waveforms of different frequency and amplitude to see the resulting modulating signal and its impact on the modulated RF signal. Adjust the carrier frequency, the carrier amplitude, and the speed of the dynamic display, as desired. Alternatively, select the microphone option to input your own voice or sound and observe in real time the complexity of the signals. Freeze the displays for careful examination of the signals, or take a snapshot of the displays in .png format for downloading.
FM Simulator:
Identical to the AM Simulator, but producing a visualization of a frequency-modulated RF carrier. Build a modulating signal with various sine wave inputs, or use your microphone for complex audio input. This simulator adds a slider control for FM deviation level, adjusting the relationship between baseband amplitude and RF carrier frequency deviation. The carrier deviations are somewhat exaggerated so that they are readily observed, as FM signal deviations are quite subtle. (A typical FM signal's 5 kHz deviation will result in wavelength variation of only about 0.14 millimeter.)
Explore the fundamentals of digital modulation using FSK. Enter a text string to encode with 8-bit ASCII and select one of three FSK tone quantities: 2-FSK, 4-FSK, or 16-FSK. See and hear the message encoded using your selected FSK method, with each unique tone symbol color-coded for differentiation in the display as well as represented in a stairstep diagram. The commensurate binary digital values are also displayed under each color-coded wave segment, and each resultant text character is displayed with an underscore grouping the eight binary values that represent it. Zoom and display scroll controls are provided to enlarge the display when needed for careful examination of the results Easily compare symbol rates (baud) and data rates across the different FSK methods.
Fourier Transform Visualizer:
This app lets you construct complex waveforms of any type from individual sine wave components. By adding sine components and manipulating the frequency, amplitude, and phase of each, any type of complex signal can be fabricated and displayed in the time domain view and the frequency domain view. Using the vector-summed output of linked circles, or epicycles, as analogs of sine components, an intuitive visual understanding of complex signal composition is gained. Presets provide standard square wave and sawtooth wave components, and an option to use fractional harmonic values illustrates how non-repeating, shifting signals result. Perfect for illustrating how Fourier Transforms provide an analysis of complex signal composition in the frequency domain, and an amazingly simple illustration of how any signal is a combination of various sinewave signals - a concept that is almost impossible to impart without a signal visualization tool.
Time and Frequency Domain FFT Analyzer:
Describing the time and frequency domains of signals is always a challenge for student. With this app you can record your own audio signal and see it represented in the time domain and the frequency domain. Zoom in and out on displays for detailed analysis. Playback the audio signal at reduced speed but without pitch / frequency shifts to examine the dynamics of the FFT analysis. Standard stock audio signals are also provided, such as square wave, sawtooth wave, sine wave, and sweeping sine wave signals.
Filter Simulator:
This app let's you see and hear the effects of various real-world filter types on audio. Like the Time and Frequency Domain FFT Analyzer, it depicts time and frequency domain views with filter effects depicted in the frequency domain view spectrum scope display. Select high-pass, low-pass, band-pass, band reject, or notch filter types and adjust bandwidth, sharpness, and center frequency. Record your own audio for examination with filtering or use stock options such as white noise. Playback audio at slow speed without pitch changes for careful dynamic analysis, and select from four different FFT window sample sizes. Student quickly obtain an intuitive comprehension of filter effects.
Enjoy fiddling with these apps, and if you have suggestions be sure to drop us a note with your ideas.