More Visualization Apps!
HRS Visualization Apps: https://hamradioschool.com/vis-apps.html
Earlier this year our article Ham Radio School Visualization Apps described some new web-based apps developed by Ham Radio School to help students grasp challenging radio concepts through visually compelling interaction. These apps were also developed with license class instructors in mind for use in the classroom. These initial apps demonstrate concepts including modulation, Fourier transforms and synthesis, filters, SWR, digital modes, SSB and CW QRM effects, Ohm's Law, and more.
Recently we expanded our visualization app suite with additional interactive apps to help students comprehend or explore basic antenna radiation patterns, the Maidenhead Grid locator system, and ionospheric skip propagation factors. Let's take a brief look at each of these new apps.
Vertical Antenna Visualizer
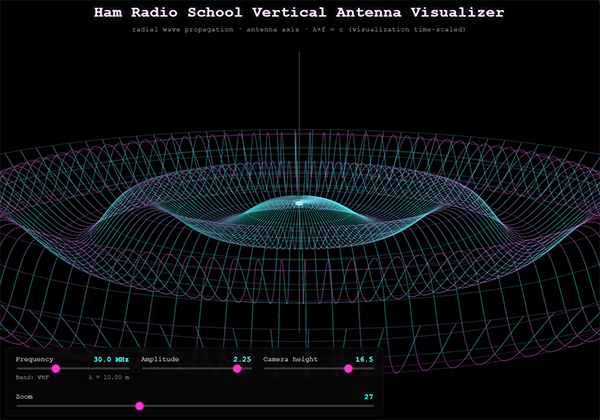
This simple app displays a 3D interactive animation of sinewave signals propagating from a vertical antenna. Our Technician License Course Lesson Ø presents an analogy of water waves expanding away from a pebble dropped into a calm pool for this pattern of RF propagation. This app brings that analogy to life with brilliant 3D visuals. The user can manipulate the frequency and amplitude of the signal, zoom in or out, and adjust the viewpoint for a variety of perspectives. Electrical charge is represented simply as a bright sphere oscillating on the vertical axis as RF electromagnetic waves ripple away and expand in all radial directions around the antenna axis. See it.
Horizontal Dipole Visualizer
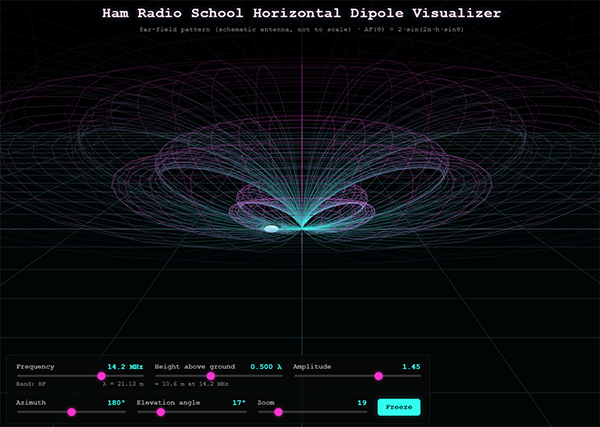
A similar radiation pattern visualizer is available for the horizontal dipole antenna. Electrical charge is depicted moving back and forth through the antenna axis while lobes and nulls of RF radiation are created, radiating away from the antenna into the environment.
The dipole is assumed to be mounted above the earth between 1/8 wavelength and 1 wavelength high. This parameter is adjusted by the user to instantly see the effects of antenna height on the radiation pattern. With the initial default height of 1/2 wavelength, two predominant low-angle lobes are easily identified. Adjusting height above ground to a smaller fraction of a wavelength manifests clear near-vertical incidence skywave (NVIS) radiation, with most energy directed at steep vertical angles. Near 1 wavelength in height, multiple lobes including very low takeoff angles are generated.
Users may also adjust signal frequency, amplitude, and viewpoint by azimuth, elevation, and zoom level. A freeze frame function is also provided. See it.
Horizontal Dipole Interference Visualizer
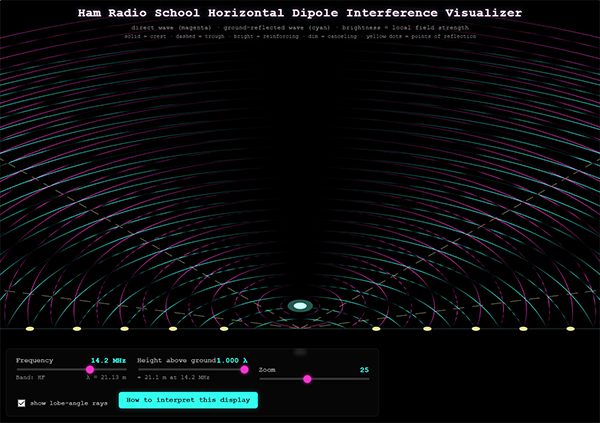
The horizontal dipole's radiation pattern lobes and nulls are produced by wave interposition between directly radiated waves and waves reflected from the ground. This app visually illustrates how these wave interactions produce lobes and nulls.
A stable elevation view is presented with a viewpoint directly down the axis of the dipole. RF waves radiate away from the antenna as magenta arcs. Reflections of these waves from the earth's surface are depicted as cyan arcs, mathematically computed for realistic geometry. Wave crests are depicted as solid-line arcs and wave troughs as dashed-line arcs. When direct and reflected waveforms are significantly in phase and produce relatively strong signals, the arcs become bright. Where interacting waves cancel one another, out-of-phase, the arcs dim. Yellow dashed lines mark the takeoff angles where direct and reflected waves are perfectly in-phase, producing the strongest signals. Bright lobes and dim nulls of the elevation radiation pattern are readily visualized.
The user can adjust the dipole height above ground between 1/8 and 1 wavelength, observing the waveform interactions and resultant antenna patterns. Frequency and zoom controls are also provided for variety. A textual legend may be optionally displayed that explains the full visual depiction. See it.
Phased Array Visualizer
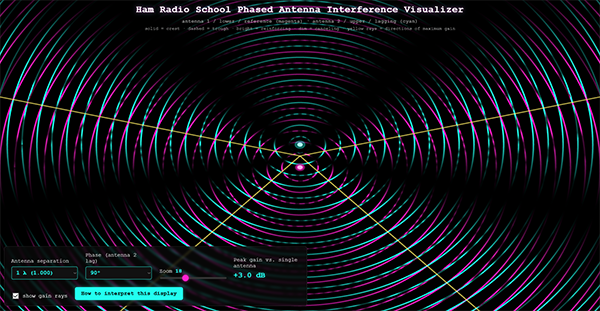
Similar to the Horizontal Dipole Interference Visualizer, this app targeting the Extra License student provides an azimuthal view of the radiation patterns generated by two phased 1/4-wave vertical antennas. Each of the two depicted antennas radiates waveforms that are differentiated in color, allowing the user to see where waveforms reinforce one another in-phase and where they cancel one another out-of-phase. The resultant pattern lobes and nulls are indicated by the brightness of the waveforms radiating away from the phased pair, and rays of maximum strength are indicated within the lobes where waveforms are perfectly in phase.
The user may select any combination of standard phased array antenna separation distances from 1/8 wavelength to 1 full wavelength. Any of these separation distances may be combined with a selection of signal phasing differences fed to the antenna pair — a standard selection set from 0 to 180 degrees phase difference.
With each unique combination of separation distance and phase difference a unique radiation pattern and resultant gain calculation is displayed. A total of 40 different gain patterns can be examined. This app is great for illustrating the various configurations of phased array antenna pairs to affect a variety of directional gain patterns.
Maidenhead Grid Location Explorer
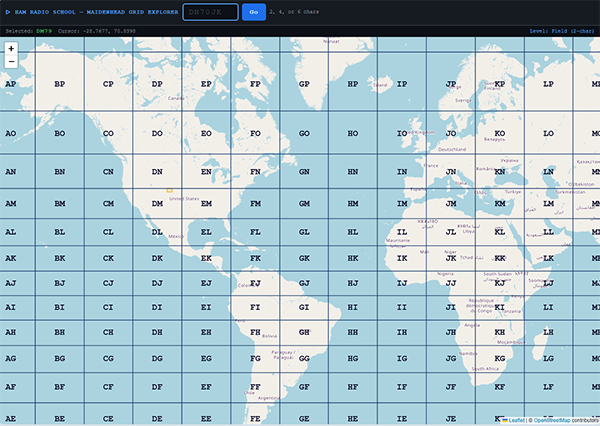
The Maidenhead Grid Locator System is a universal system for specifying geographic location of radio stations on the surface of earth. It is widely used in contesting and general radio operations to exchange location information among stations. This app is an interactive explorer for the Maidenhead system, allowing the user to scroll and zoom around the globe, clicking to highlight and identify grids and zooming from world-wide to detailed local mapping. The user may enter a grid identifier (2, 4, or 6 character formats) to instantly load the specified grid into the display. Users will quickly grasp the friendly user interface, highlighting schema, and control functions. See it.
HF Ionospheric Skip Visualizer
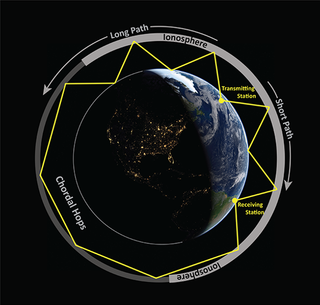
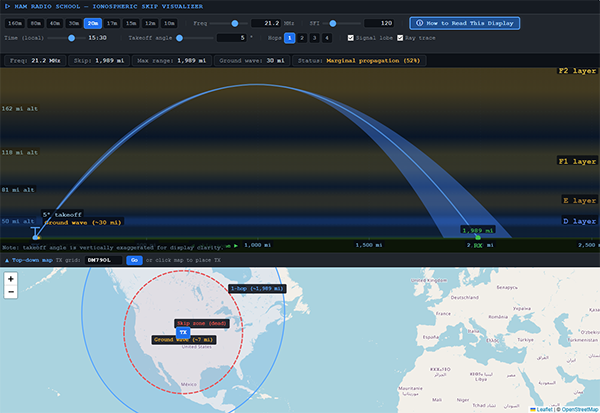
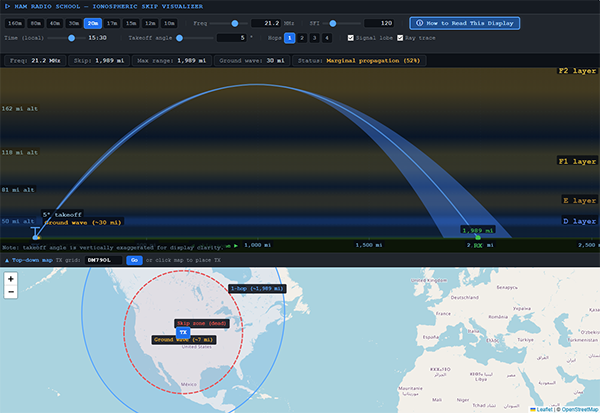
HF skip propagation is affected by several factors including carrier frequency, solar flux index and resultant ionosphere density, time of day, and signal takeoff angle. This app allows the user to manipulate each of these parameters and see the effect on skip distance. The fundamental impacts of these factors are intuitively grasped simply by fiddling around with the app and making adjustments to the input variables.
The app is designed for education and not for accuracy in predicting skip performance. Comprehending the fundamental effects of the variables are the primary learning goal with this app. Adjust the transmitting frequency to see typical skip distances shift or to see the signal fade away (closed band). Adjust the signal takeoff angle to see the skip distance change or to see the signal veer off into space at steep angles. Adjust the time of day to see when the different amateur bands are effective throughout the day-night cycle. Multiple hop propagation estimates are also provided as an optional display feature, and ground wave distance estimates are depicted.
An optionally displayed world map may be unfolded at the bottom of the display to visualize the approximated skip zone radius and skip distance radius. Enter a Maidenhead Grid identifier to center these estimated zones over any desired location on earth.
A textual legend is optionally displayed explaining the graphic elements of the display and other characteristics of the model. See it.
Upgrade to the Fourier Synthesis Visualizer
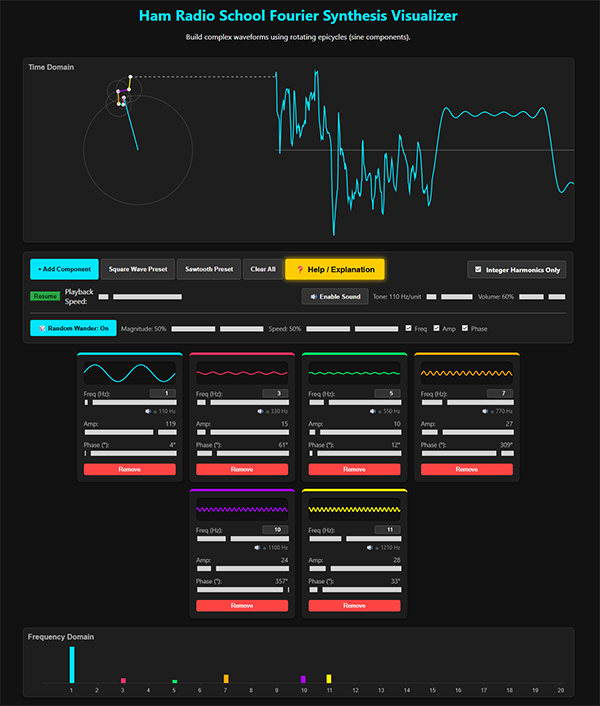
The previously published Fourier Synthesis Visualizer has been upgraded to include audio output and randomized variations to represent dynamic non-repeating complex signals. This app allows the user to synthesize complex signals by summing up to eight pure sine wave signals and observe the time domain result that tracks from rotating vectors (epicycles) representing each sine component. Presets for synthesis of square waves and sawtooth waves are provided, as well as a frequency domain view that displays the frequency ingredients of each synthesized signal.
The audio upgrade provides optional sound output generated by a scalar multiplication of each added sine frequency to boost it into human perceptual range. The user can hear an audio analog of any synthesized signal by simply clicking the Enable Sound button.
Following sound enabling, the user may optionally activate the Random Wander feature. As the name implies, Random Wander randomly changes the target value for each sine component's frequency, amplitude, and phase. It then smoothly moves these parameters toward the new target value. User controls allow the selection of parameters to be changed by Random Wander, how far a parameter may vary from the initial value established by the user, and how rapidly the move toward the new targets progresses. The purpose of Random Wander is to demonstrate how non-repeating complex audio signals sound and to illustrate a speech-like characteristic that manifests with multiple frequency components at the higher end of the Random Wander magnitude and speed ranges. It is easy for the student to mentally extrapolate from 6 or 8 pure tones in Random Wander mode to thousands of individual sine signals similarly varying in speech audio signals. The display visuals track right along with the random changes making for a compelling and spellbinding lesson feature.
This app is terrific for providing an intuitive understanding of Fourier synthesis of complex waveforms and for illustrating the nature of phone signals. Fiddle around with our revised Fourier Synthesis Visualizer and get the intuitive experience!
Wrap Up
These new interactive visualization apps bring the total number of apps to 18. Each app has a focused purpose and learning goal. We have integrated these apps into the Ham Radio School course curricula through our Depth Options (aka Learning Media) in each of our courses. Students are directed to one or more apps in appropriate lessons of the course so that the apps reinforce and clarify content presented in the lesson.
For example, in the new Technician License Course 2026-2030, the Ionspheric Skip Visualizer is included in the Depth Options for Lesson 5.0 Signal Propagation. The lesson describes ionospheric skip and discusses many of the factors impacting skip propagation, but the app provides the student hands-on interaction with these factors so that a detailed mental model of skip propagation fundamentals is rapidly developed.
Similarly, our new antenna radiation pattern visualizers are included in the antenna lessons of each of our courses' Depth Options. Our various modulation simulation apps are incorporated into Depth Options for lessons on signal processing. Our Fourier Transform Analyzer app is found in lessons associated with modulation and demodulation, and so on.
I hope you find our apps useful for your own learning goals or for helping others to really get it — to really understand ham radio. Use our apps to elevate your learning.
73,
Stu WØSTU